Quick Start
Pre-requirements
Before installing hkjournalist, please make sure pandoc and pdflatex are already properly installed in the environment.
pandoc: pandoc.org/installing.htmltexlive/mactex(for MacOS): [www.tug.org/texlive/ http://www.tug.org/mactex/](https://www.tug.org/texlive/ http://www.tug.org/mactex/)
Install
pip install hkjournalist
Customize your report template
Write such a md file, use a pair of {} to wrap every variable which will be assigned specified value in your code. save it to template.md
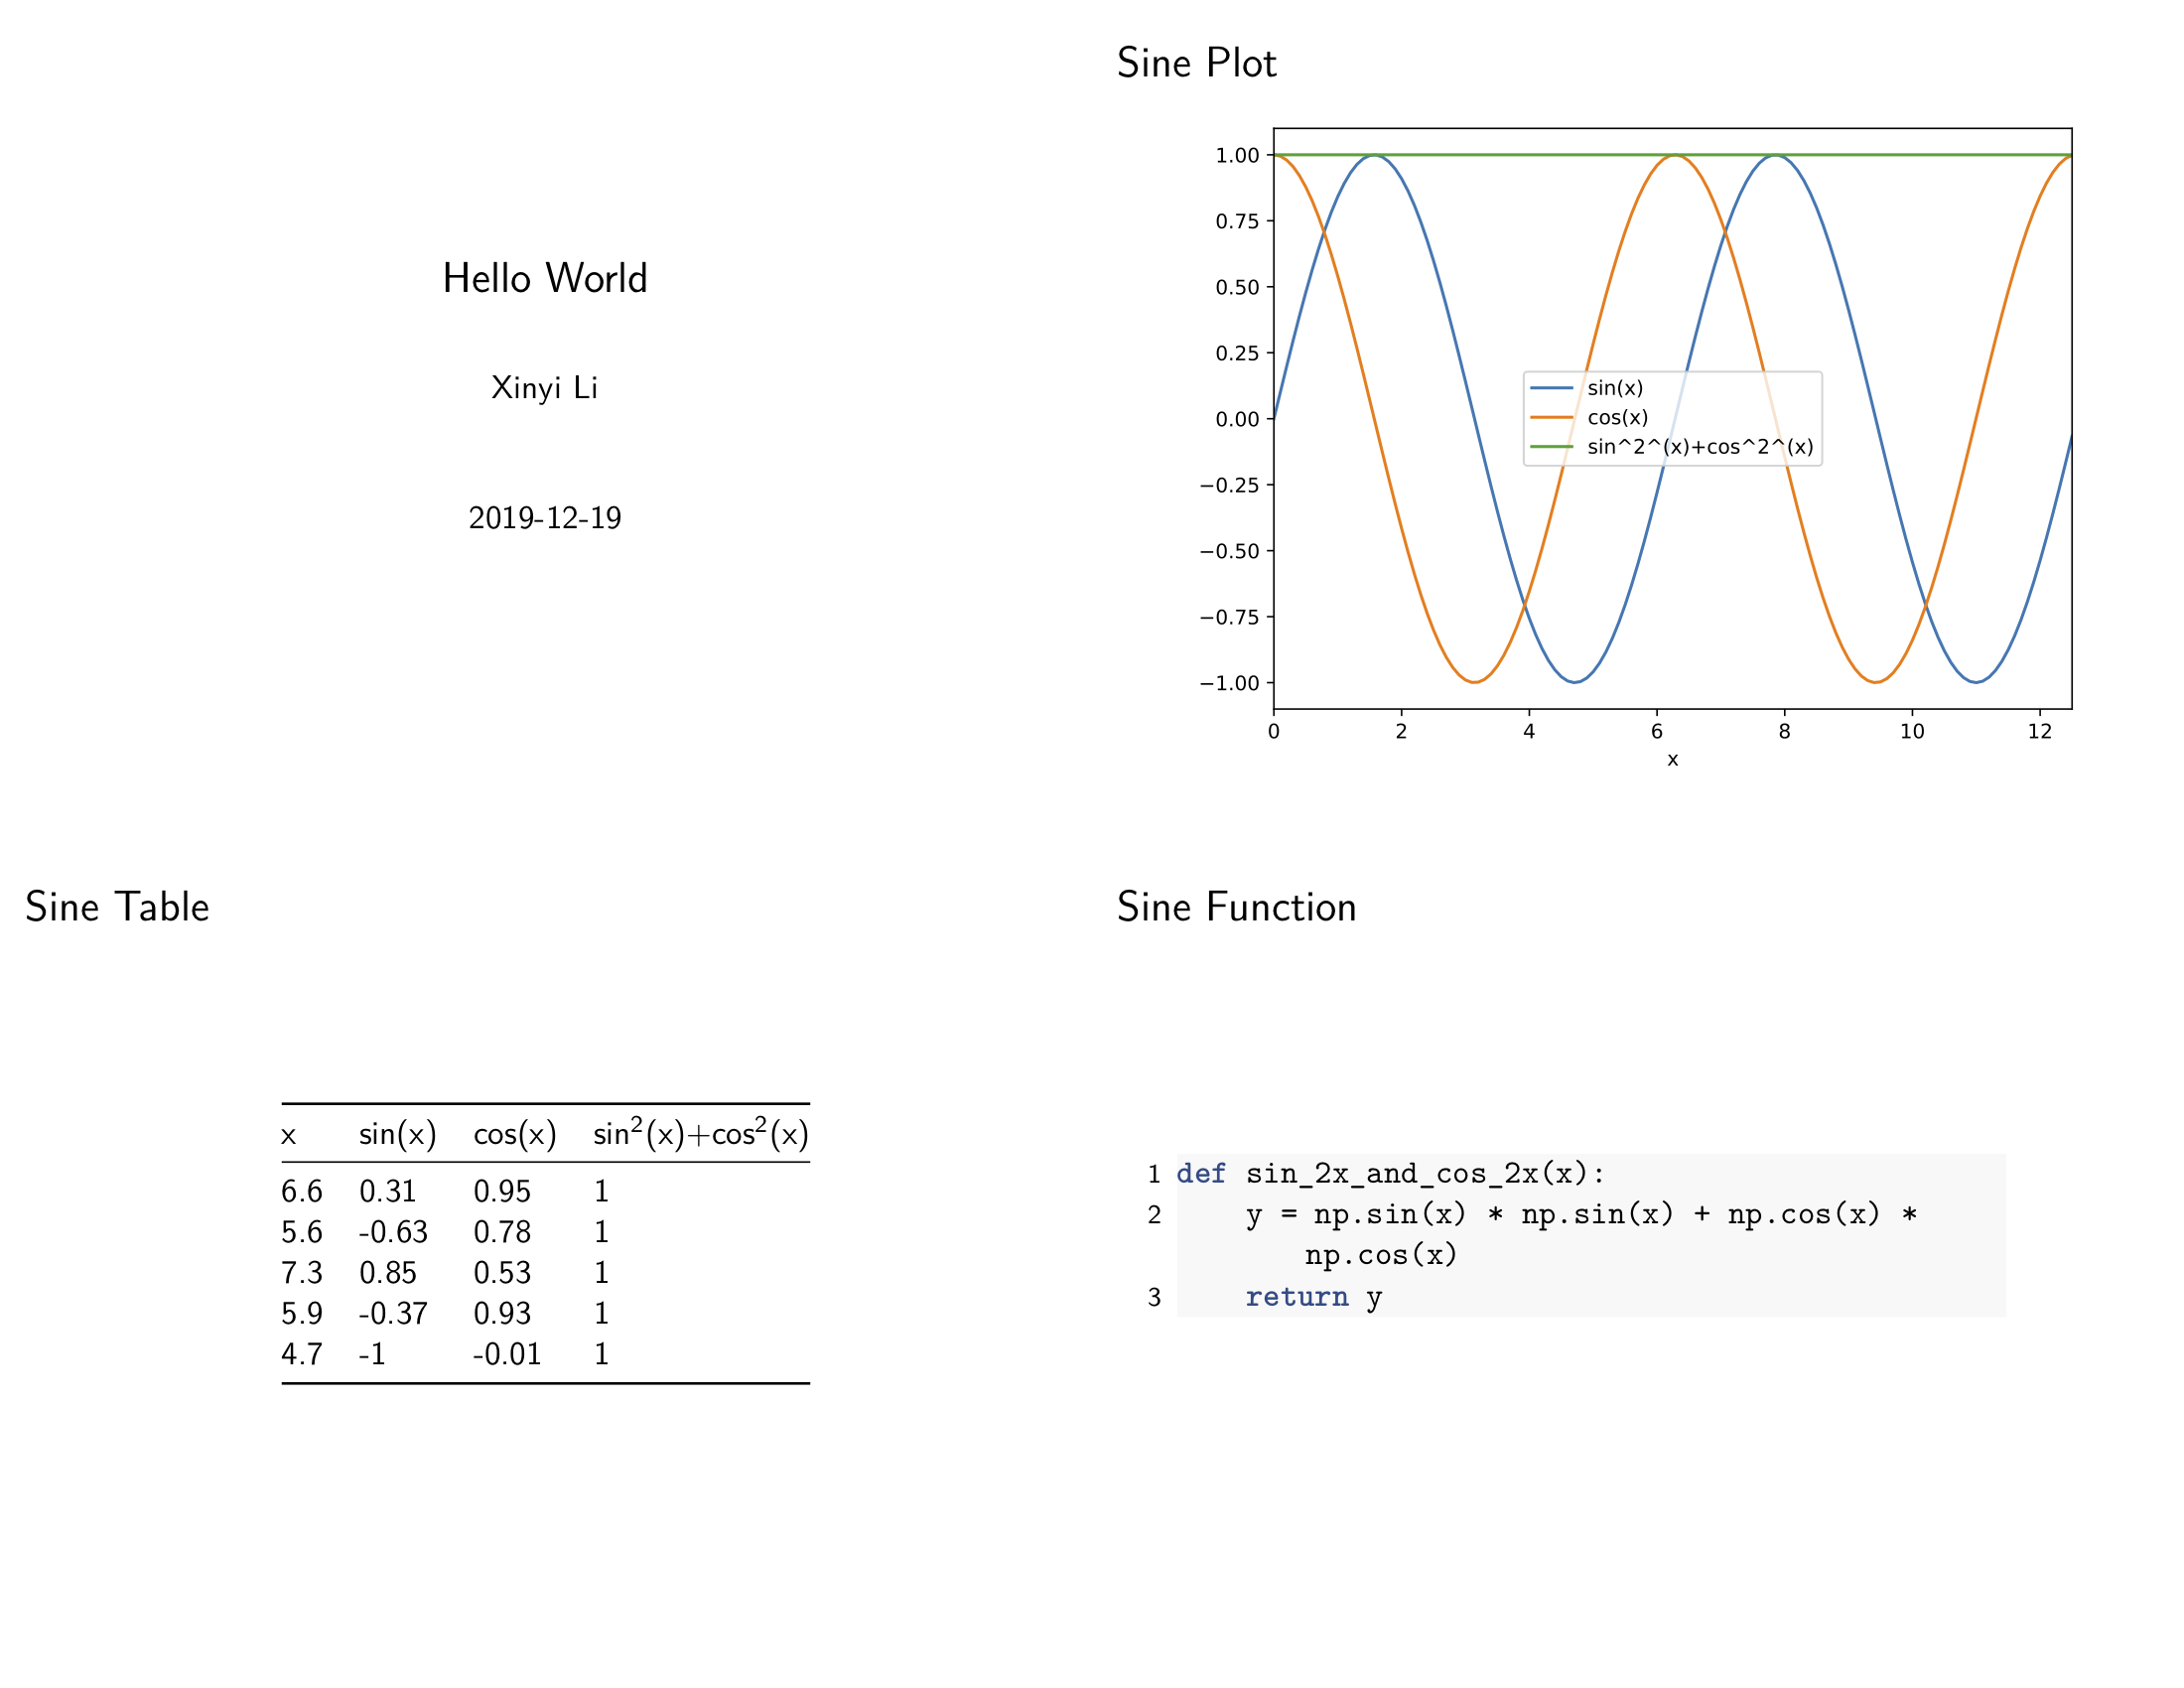
% Hello World
% Xinyi Li
% 2019-12-19
---
### sine plot

### sine table
{sin_table}
### sine function
```{{.python}}
{sin_func}
```
Run a Journalist() in your code to fetch variables
First, you should define a dict to record mapping with variable names and their value
from hkjournalist import Journalist

config = {}
Then, start your programming, and do not forget to assign value to corresponding variable names in config:
def sin_2x_and_cos_2x(x):
    y = np.sin(x) * np.sin(x) + np.cos(x) *  np.cos(x)
    return y

x = np.arange(0, 4 * np.pi, 0.1)
y1 = np.sin(x)
y2 = np.cos(x)

df = pd.DataFrame({'x': x, 'sin(x)': y1, 'cos(x)': y2})
df['sin^2^(x)+cos^2^(x)'] = sin_2x_and_cos_2x(df['x']).values
df = df.set_index('x')

# plot sine curve as sin_plot
ax = df.plot()
plt.tight_layout()
config['sin_plot'] = ax

# random select 5 point (x,y) as sin_table
config['sin_table'] = df.sample(5)

# sin_2x_and_cons_2x as sin_func
config['sin_func'] = sin_2x_and_cos_2x
Invite a journalist to make a big news report
Last but not least, attach 3 lines critical code below to have your Journalist make a report and save it to big_news.pdf (you can get all code above in demo and the output file big_news.pdf)
# HK journalist runs faster than everyone! hear variable and make a report
reporter = Journalist(template_file='template.md')
reporter.hear(config)
reporter.report(output_file='big_news.pdf', beamer=True, overwrite=True)
Report slides display as below:
Final question: What will my variables on slides look like?
All variables pass to Journalist via hear will display as strings just like what their __str__ method do.
Except for 4 types with special support:
pandas.DataFrame: -> a 3-line table (TeXdefault style)matplotlib.axes.SubplotBase(known as base figure objectaxinmatplotlib): -> a figure print on report (with high quality and small size aspdf)function: -> its full definitionlist(str): ->len(list)followed by a sentance with all words concatenated.