Tutorial 2: EDA and select feature
- Code and output: example/2_feature_selection.py
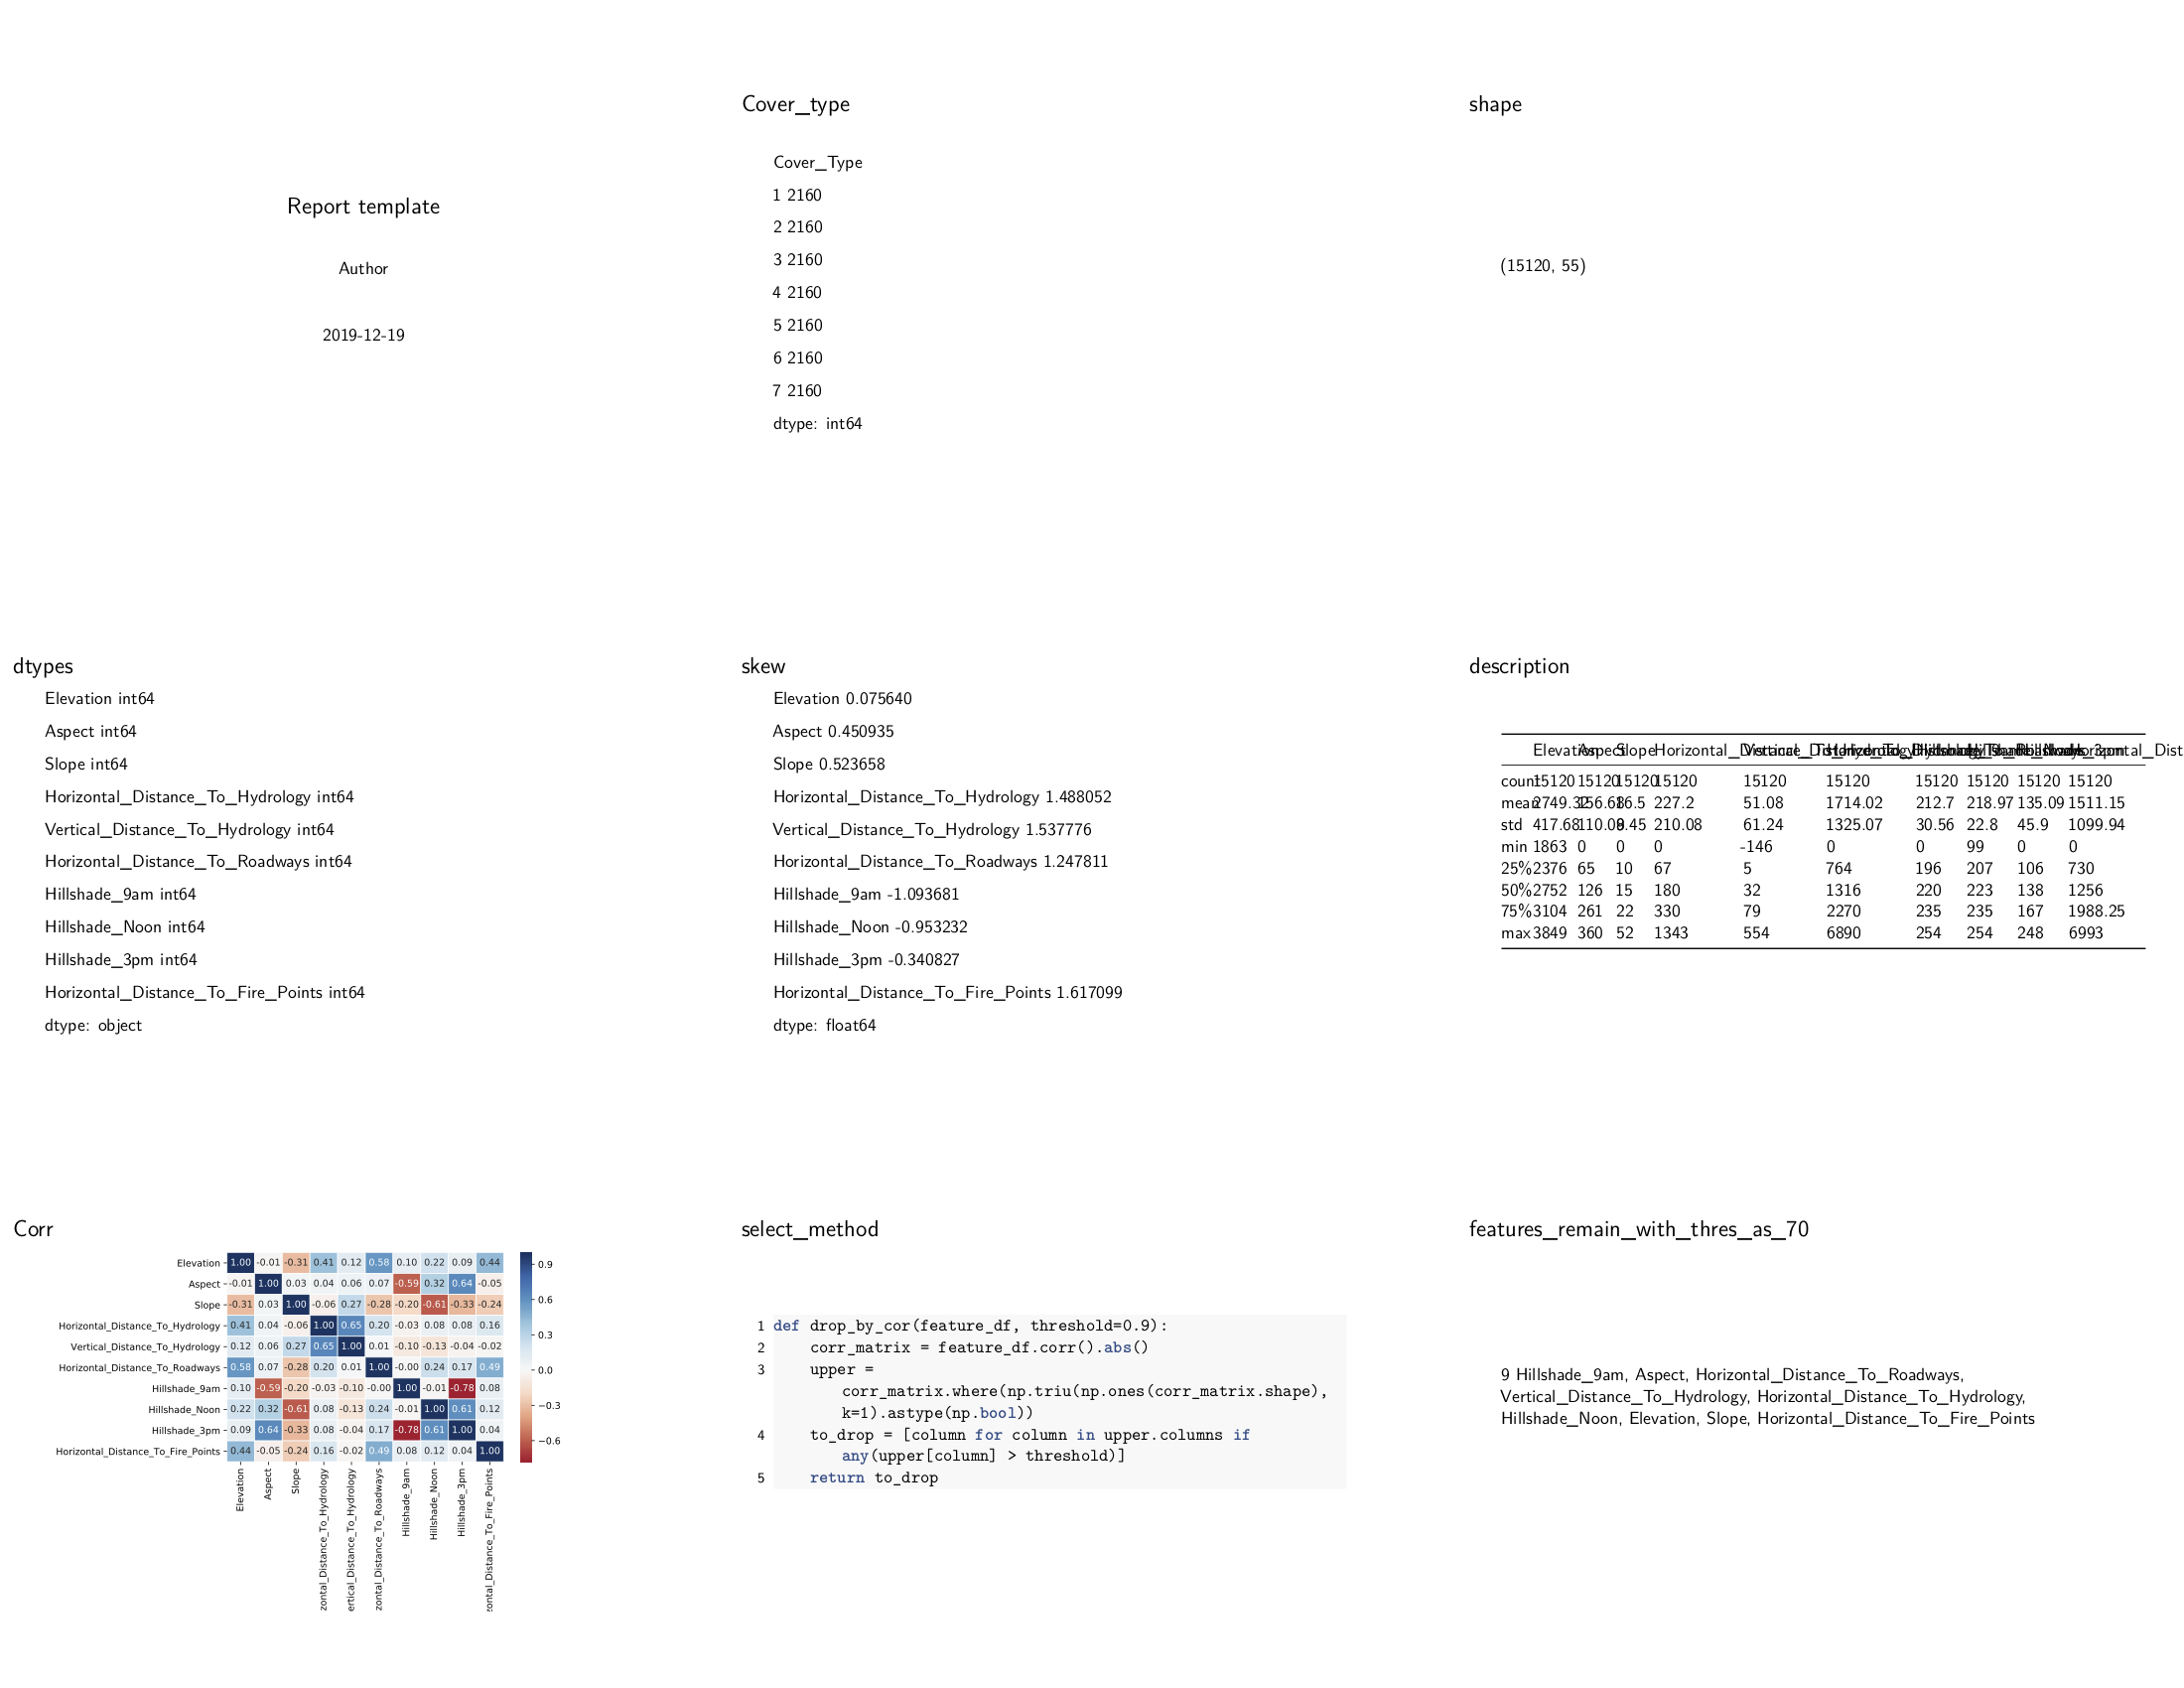
- Data from Kaggle Contest
Load Data and pass basic statistics data to config
import numpy as np
import pandas as pd
import matplotlib.pyplot as plt
import seaborn as sns
from hkjournalist import Journalist

config = {}

df = pd.read_csv('./data/train.csv')
df = df.iloc[:, 1:]
feature_df = df.loc[:, :'Horizontal_Distance_To_Fire_Points']

# basic statistics feature
config['Cover_type'] = df.groupby('Cover_Type').size()
config['shape'] = df.shape
config['dtypes'] = feature_df.dtypes
config['skew'] = feature_df.skew()
config['description'] = feature_df.describe()
Plot the correlation matrix
data_corr = feature_df.corr()
plt.figure(figsize=(8, 6))
grid = sns.heatmap(data_corr, annot=True, fmt='.2f', cmap='RdBu', center=0, linewidth=.5)
plt.tight_layout()
config['Corr'] = grid
Filter features with high correlation coefficient
def drop_by_cor(feature_df, threshold=0.9):
    corr_matrix = feature_df.corr().abs()
    upper = corr_matrix.where(np.triu(np.ones(corr_matrix.shape), k=1).astype(np.bool))
    to_drop = [column for column in upper.columns if any(upper[column] > threshold)]
    return to_drop


config['select_method'] = drop_by_cor
threshold = 0.7

valid_features = list(set(feature_df.columns) - set(drop_by_cor(feature_df, threshold)))
config[f'features_remain_with_thres_as_{int(threshold * 100)}'] = valid_features
Too many variables to write a template by hand? don’t worry, just call generate_template method!
HKJournalist can use auto-generated template before making a big report!
report_journalist = Journalist()
report_journalist.hear(config)
report_journalist.generate_template('./reports/2_feature_select_template.md')
report_journalist.report('./reports/2_feature_select.pdf', overwrite=True, beamer=True, aspectratio=169)